Per-Volume fMRI Phase#
Visualize the mean gastric phase per fMRI volume using plot_volume_phase.
This is the core quantity used in gastric-brain coupling analyses.
Cut regions at the start and end (to remove filter transients) are
highlighted.
import matplotlib.pyplot as plt

import gastropy as gp
from gastropy.neuro.fmri import create_volume_windows, phase_per_volume

plt.rcParams["figure.dpi"] = 100
plt.rcParams["figure.facecolor"] = "white"
# Load fMRI-concurrent EGG
fmri = gp.load_fmri_egg(session="0001")
signal = fmri["signal"]
sfreq = fmri["sfreq"]
tr = fmri["tr"]
trigger_times = fmri["trigger_times"]

# Select best channel and process
best_idx, _, _, _ = gp.select_best_channel(signal, sfreq)
filtered, _ = gp.apply_bandpass(signal[best_idx], sfreq, low_hz=gp.NORMOGASTRIA.f_lo, high_hz=gp.NORMOGASTRIA.f_hi)
phase, analytic = gp.instantaneous_phase(filtered)

# Create volume windows and extract phase
n_volumes = len(trigger_times)
windows = create_volume_windows(trigger_times, tr, n_volumes)
vol_phase = phase_per_volume(analytic, windows)
print(f"{n_volumes} volumes, TR={tr} s")
420 volumes, TR=1.856 s
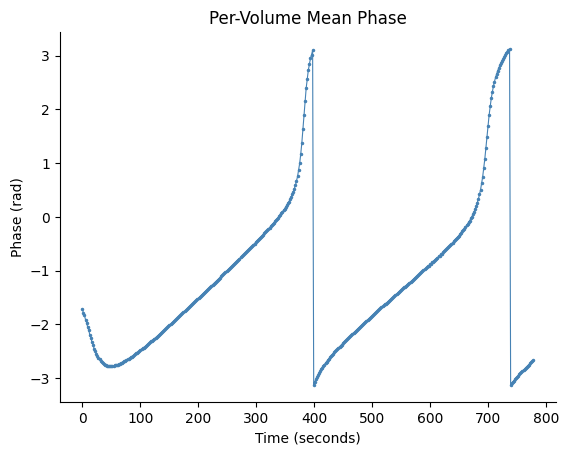
Basic Volume Phase Plot#
fig, ax = gp.plot_volume_phase(vol_phase, tr=tr)
plt.show()
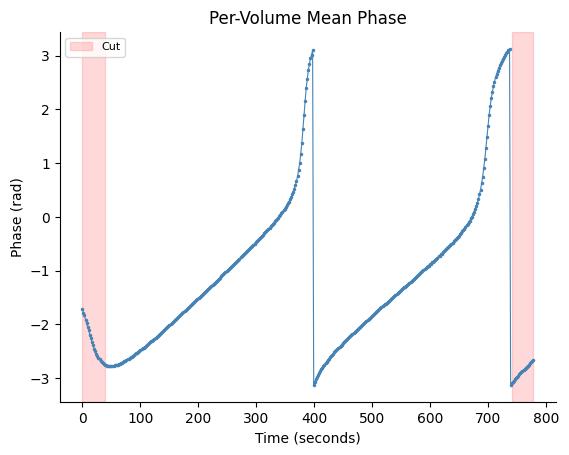
With Cut Regions#
Highlight the first and last 21 volumes that would typically be discarded to remove filter edge transients.
fig, ax = gp.plot_volume_phase(vol_phase, tr=tr, cut_start=21, cut_end=21)
plt.show()
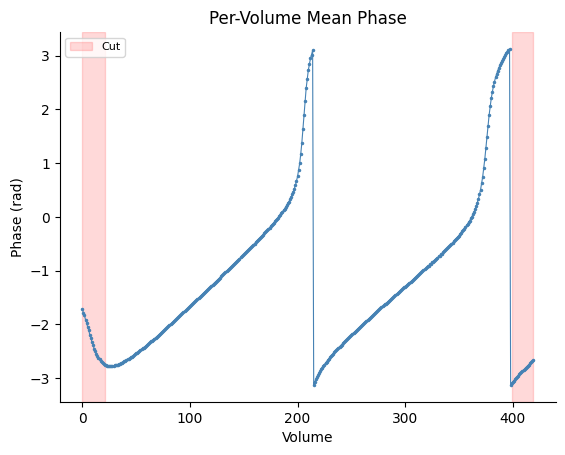
Volume Index X-Axis#
Omit tr to use volume index instead of time on the x-axis.
fig, ax = gp.plot_volume_phase(vol_phase, cut_start=21, cut_end=21)
plt.show()
See also: fMRI-EGG Pipeline, Comprehensive Figure