Channel Selection#
Select the best EGG channel from a multi-channel recording using
select_best_channel. The best channel is the one with the highest
spectral peak in the normogastric band (2–4 cpm).
import matplotlib.pyplot as plt
import numpy as np

import gastropy as gp

plt.rcParams["figure.dpi"] = 100
plt.rcParams["figure.facecolor"] = "white"
egg = gp.load_egg()
signal = egg["signal"]  # (7, n_samples)
sfreq = egg["sfreq"]
ch_names = list(egg["ch_names"])
print(f"{signal.shape[0]} channels, {signal.shape[1]} samples")
7 channels, 7580 samples
Automatic Selection#
best_idx, peak_freq, freqs, best_psd = gp.select_best_channel(signal, sfreq)

print(f"Best channel: {ch_names[best_idx]} (index {best_idx})")
print(f"Peak frequency: {peak_freq:.4f} Hz ({peak_freq * 60:.2f} cpm)")
Best channel: EGG6 (index 5)
Peak frequency: 0.0530 Hz (3.18 cpm)
Compare All Channels#
Use select_peak_frequency on each channel individually to
compare peak frequencies and power.
print(f"{'Channel':<10} {'Peak (Hz)':<12} {'Peak (cpm)':<12} {'Max Power':<12}")
print("-" * 46)
for i in range(signal.shape[0]):
    pf, f, p = gp.select_peak_frequency(signal[i], sfreq)
    marker = " <-- best" if i == best_idx else ""
    if np.isnan(pf):
        print(f"{ch_names[i]:<10} {'no peak':<12} {'---':<12} {'---':<12}")
    else:
        max_pow = p[np.argmin(np.abs(f - pf))]
        print(f"{ch_names[i]:<10} {pf:<12.4f} {pf * 60:<12.2f} {max_pow:<12.6f}{marker}")
Channel    Peak (Hz)    Peak (cpm)   Max Power
----------------------------------------------
EGG1       0.0520       3.12         0.000000
EGG2       0.0380       2.28         0.000000
EGG3       0.0520       3.12         0.000000
EGG4       0.0350       2.10         0.000000
EGG5       0.0370       2.22         0.000000
EGG6       0.0530       3.18         0.000000     <-- best
EGG7       0.0530       3.18         0.000000
# Visualize with multi-channel PSD
psd_matrix = np.array(
[gp.psd_welch(signal[i], sfreq, fmin=0.0, fmax=0.1, overlap=0.75)[1] for i in range(signal.shape[0])]
)
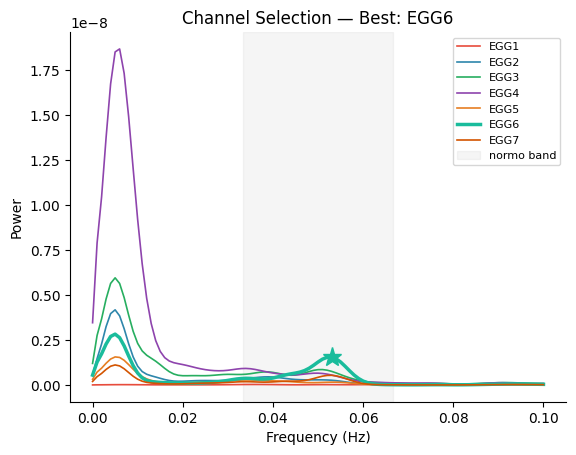
fig, ax = gp.plot_psd(freqs, psd_matrix, ch_names=ch_names, best_idx=best_idx, peak_freq=peak_freq)
ax.set_title(f"Channel Selection — Best: {ch_names[best_idx]}")
plt.show()
See also: PSD Visualization, PSD Parameters