EGG Signal Overview#
Create a 4-panel overview figure showing the raw signal, bandpass-filtered
signal, instantaneous phase, and amplitude envelope using plot_egg_overview.
import matplotlib.pyplot as plt

import gastropy as gp

plt.rcParams["figure.dpi"] = 100
plt.rcParams["figure.facecolor"] = "white"
# Load data and select best channel
egg = gp.load_egg()
best_idx, _, _, _ = gp.select_best_channel(egg["signal"], egg["sfreq"])
best_signal = egg["signal"][best_idx]

# Process through the full pipeline
signals_df, info = gp.egg_process(best_signal, egg["sfreq"])
print(f"Channel: {list(egg['ch_names'])[best_idx]}")
print(f"Peak: {info['peak_freq_hz'] * 60:.1f} cpm")
Channel: EGG6
Peak: 3.2 cpm
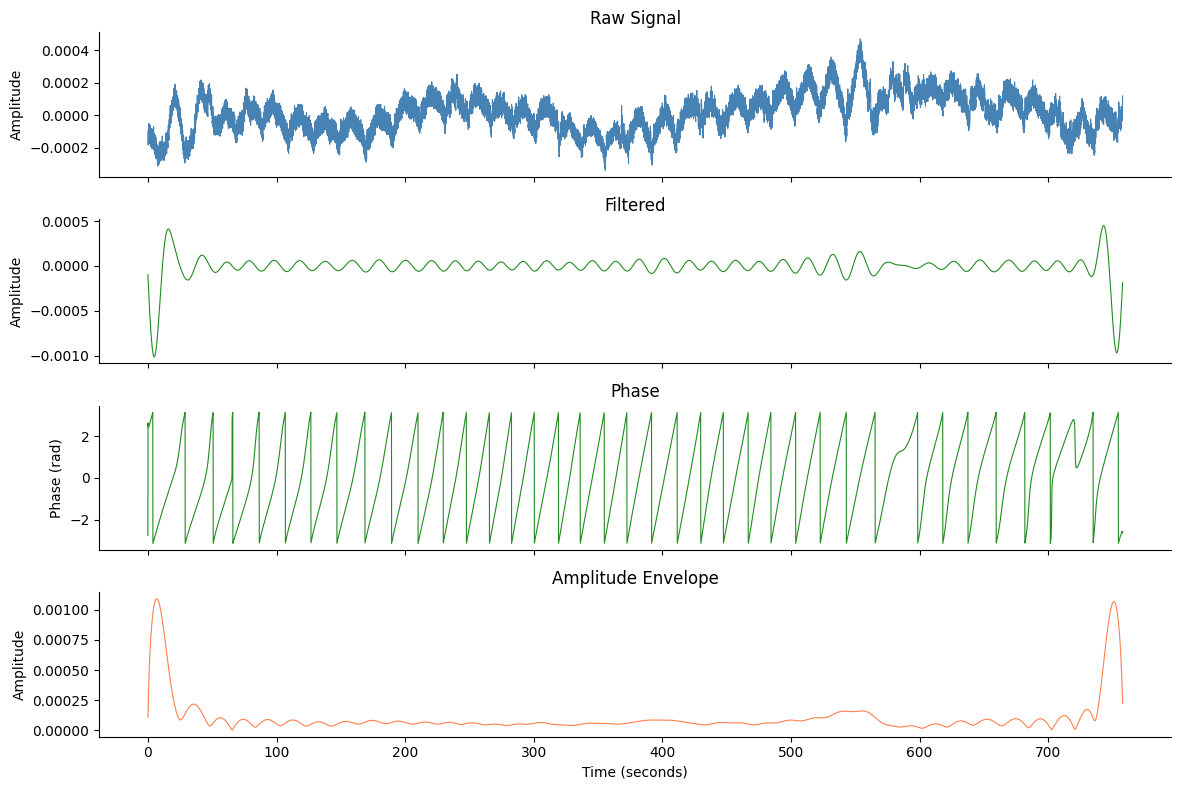
Basic Overview#
plot_egg_overview expects the DataFrame returned by egg_process
(columns: raw, filtered, phase, amplitude).
fig, axes = gp.plot_egg_overview(signals_df, egg["sfreq"])
plt.show()
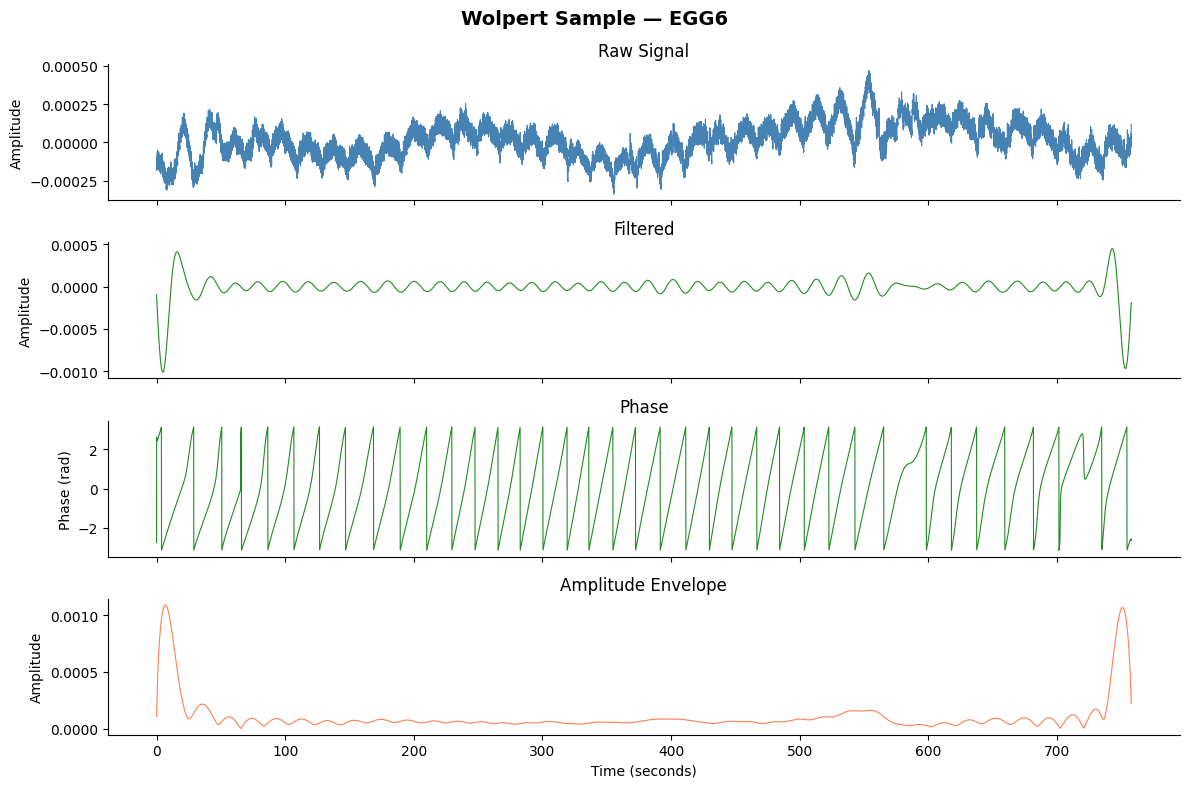
With a Title#
fig, axes = gp.plot_egg_overview(
    signals_df,
    egg["sfreq"],
    title=f"Wolpert Sample — {list(egg['ch_names'])[best_idx]}",
)
plt.show()
See also: Comprehensive Figure, egg_process