
Plot instantaneous heart rate#
# Author: Nicolas Legrand <nicolas.legrand@cfin.au.dk>
# Licence: Apache-2.0

from bokeh.io import output_notebook
from bokeh.plotting import show
from systole.plots import plot_rr

from systole import import_rr
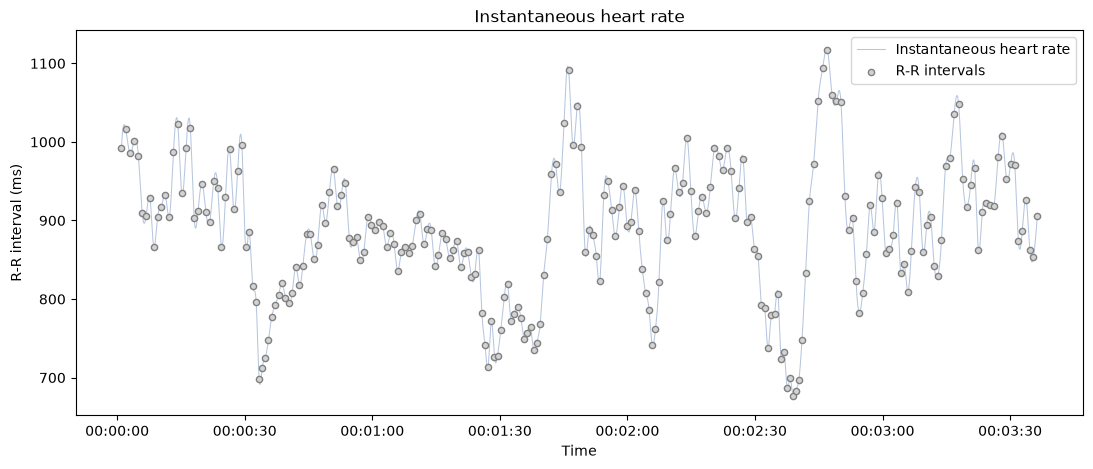
Plot instantaneous heart rate from a RR interval time series (in milliseconds).#
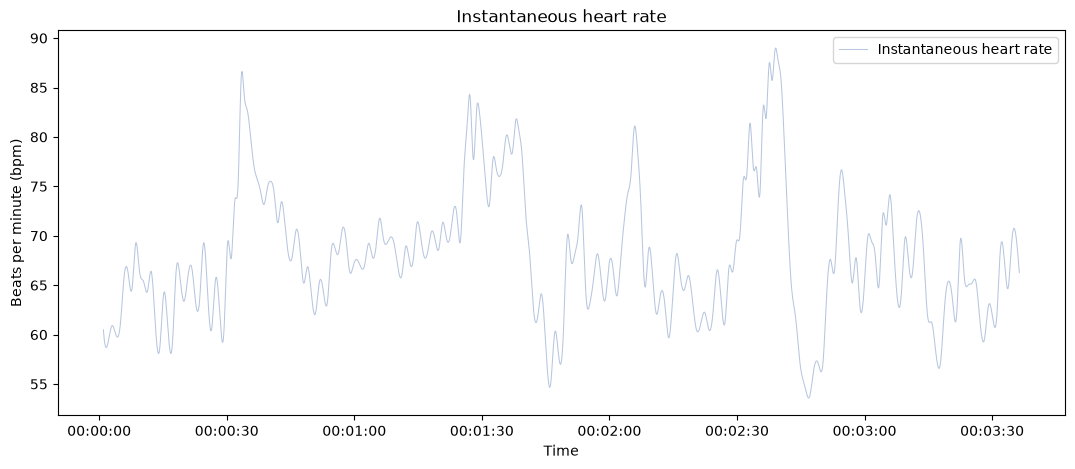
Only show the interpolated instantaneous heart rate, add a bad segment and change the default unit to beats per minute (BPM).#
Use Bokeh as a plotting backend, only show the scatterplt and highlight artefacts in the RR intervals#
output_notebook()

show(
    plot_rr(
    rr=rr, input_type="rr_ms", backend="bokeh",
    line=False, show_artefacts=True
    )
)