Plot circular#
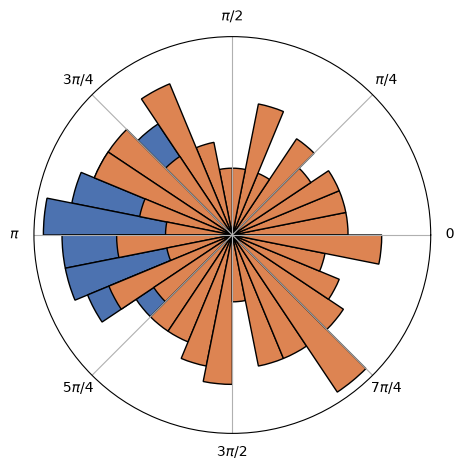
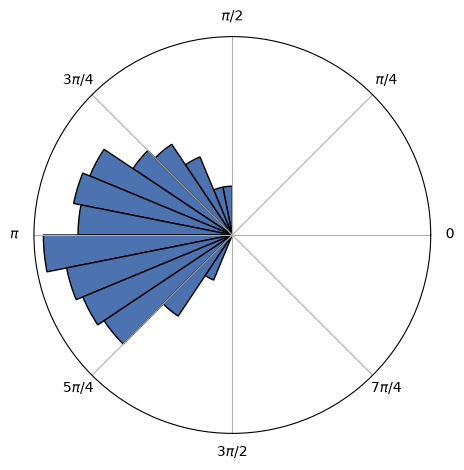
The density function can be represented using the area of the bars, the height or the transparency (alpha). The default behaviour will use the area. Using the heigth can visually biase the importance of the largest values. Adapted from [#]_.
The circular mean was adapted from Pingouin’s implementation [#]_.
.. [#] https://jwalton.info/Matplotlib-rose-plots/
.. [#] https://pingouin-stats.org/_modules/pingouin/circular.html#circ_mean
# Author: Nicolas Legrand <nicolas.legrand@cfin.au.dk>
# Licence: Apache-2.0
Using a numpy array of angular values as input#
import numpy as np
from systole.plots import plot_circular
x = np.random.normal(np.pi, 0.5, 100)
plot_circular(data=x)
/opt/hostedtoolcache/Python/3.11.16/x64/lib/python3.11/site-packages/systole/plots/backends/matplotlib/plot_circular.py:133: UserWarning: set_ticklabels() should only be used with a fixed number of ticks, i.e. after set_ticks() or using a FixedLocator. Otherwise, ticks may be mislabeled.
  ax.set_xticklabels(circle_label)
<PolarAxes: >
Using a data frame as input#
import numpy as np
import pandas as pd
from systole.plots import plot_circular

# Create angular values (two conditions)
x = np.random.normal(np.pi, 0.5, 100)
y = np.random.uniform(0, np.pi*2, 100)
data = pd.DataFrame(data={'x': x, 'y': y}).melt()

plot_circular(data=data, y='value', hue='variable')
/opt/hostedtoolcache/Python/3.11.16/x64/lib/python3.11/site-packages/systole/plots/backends/matplotlib/plot_circular.py:133: UserWarning: set_ticklabels() should only be used with a fixed number of ticks, i.e. after set_ticks() or using a FixedLocator. Otherwise, ticks may be mislabeled.
  ax.set_xticklabels(circle_label)
/opt/hostedtoolcache/Python/3.11.16/x64/lib/python3.11/site-packages/systole/plots/backends/matplotlib/plot_circular.py:133: UserWarning: set_ticklabels() should only be used with a fixed number of ticks, i.e. after set_ticks() or using a FixedLocator. Otherwise, ticks may be mislabeled.
  ax.set_xticklabels(circle_label)
<PolarAxes: >