
Plot short and long invertvals#
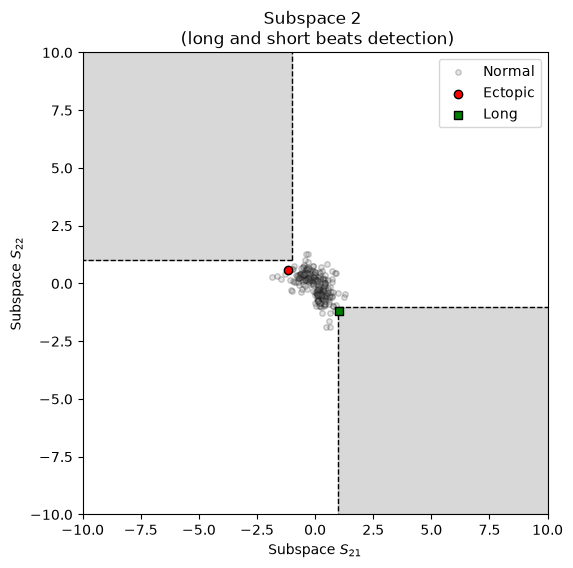
Visualization of short, long, extra and missed intervals detection.
The artefact detection is based on the method described in [1]_.
.. [1] Lipponen, J. A., & Tarvainen, M. P. (2019). A robust algorithm for heart rate variability time series artefact correction using novel beat classification. Journal of Medical Engineering & Technology, 43(3), 173–181. https://doi.org/10.1080/03091902.2019.1640306
# Author: Nicolas Legrand <nicolas.legrand@cfin.au.dk>
# Licence: Apache-2.0
Visualizing short/long and missed/extra intervals from a RR time series#
from systole import import_rr
from systole.plots import plot_shortlong

# Import PPG recording as numpy array
rr = import_rr().rr.to_numpy()

plot_shortlong(rr)
<Axes: title={'center': 'Subspace 2 \n (long and short beats detection)'}, xlabel='Subspace $S_{21}$', ylabel='Subspace $S_{22}$'>
Visualizing ectopic subspace from the artefact dictionary#
from systole.detection import rr_artefacts

# Use the rr_artefacts function to short/long and extra/missed intervals
artefacts = rr_artefacts(rr)

plot_shortlong(artefacts=artefacts)
<Axes: title={'center': 'Subspace 2 \n (long and short beats detection)'}, xlabel='Subspace $S_{21}$', ylabel='Subspace $S_{22}$'>
Using Bokeh as plotting backend#
from bokeh.io import output_notebook
from bokeh.plotting import show
from systole.detection import rr_artefacts
output_notebook()

show(
    plot_shortlong(
        artefacts=artefacts, backend="bokeh"
        )
)