
Plot pointcare#
# Author: Nicolas Legrand <nicolas.legrand@cfin.au.dk>
# Licence: Apache-2.0
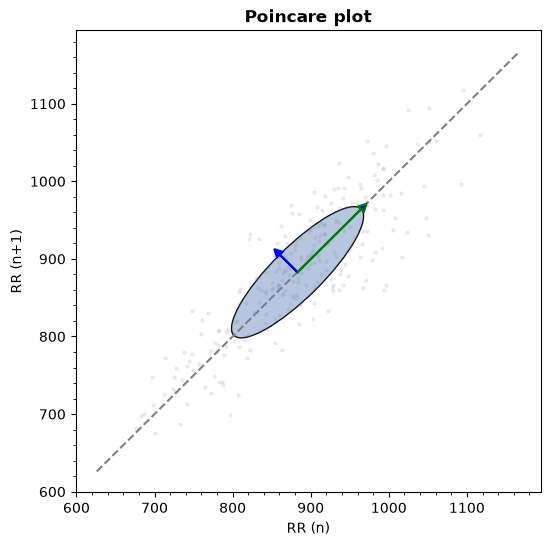
Visualizing poincare plot from RR time series using Matplotlib as plotting backend#
from systole import import_rr
from systole.plots import plot_poincare

# Import PPG recording as numpy array
rr = import_rr().rr.to_numpy()

plot_poincare(rr, input_type="rr_ms")
<Axes: title={'center': 'Poincare plot'}, xlabel='RR (n)', ylabel='RR (n+1)'>
Using Bokeh as plotting backend#
from bokeh.io import output_notebook
from bokeh.plotting import show
output_notebook()

from systole import import_rr
from systole.plots import plot_poincare

show(
    plot_poincare(rr, input_type="rr_ms", backend="bokeh")
)