
Plot raw physiological signal#
# Author: Nicolas Legrand <nicolas.legrand@cfin.au.dk>
# Licence: Apache-2.0


from bokeh.io import output_notebook
from bokeh.plotting import show
from systole.plots import plot_raw

from systole import import_dataset1, import_ppg
Plot raw ECG signal#
0%| | 0/2 [00:00<?, ?it/s]
Downloading ECG channel: 0%| | 0/2 [00:00<?, ?it/s]
Downloading Respiration channel: 0%| | 0/2 [00:00<?, ?it/s]
Downloading Respiration channel: 100%|██████████| 2/2 [00:00<00:00, 264.73it/s]
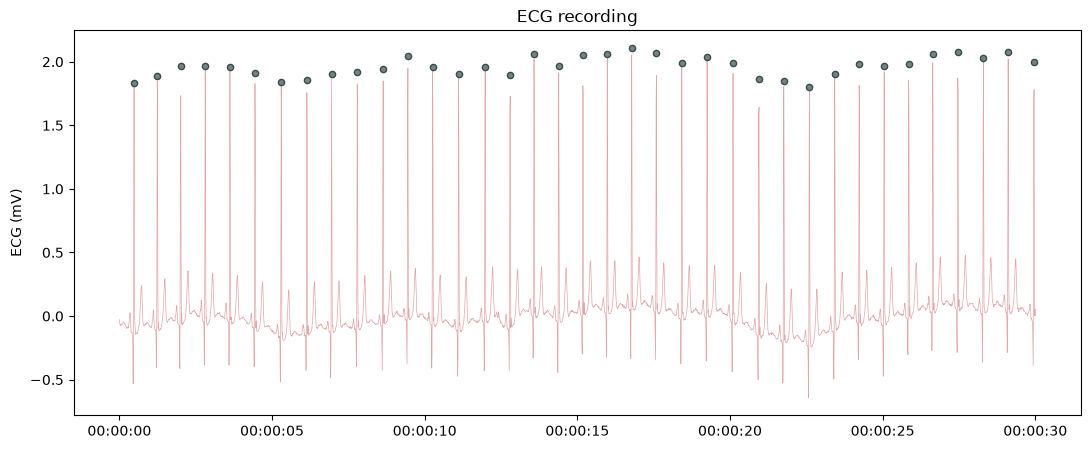
<Axes: title={'center': 'ECG recording'}, ylabel='ECG (mV)'>
Plot raw PPG signal#
Import Respiration recording as pandas data frame
0%| | 0/1 [00:00<?, ?it/s]
Downloading Respiration channel: 0%| | 0/1 [00:00<?, ?it/s]
Downloading Respiration channel: 100%|██████████| 1/1 [00:00<00:00, 353.35it/s]
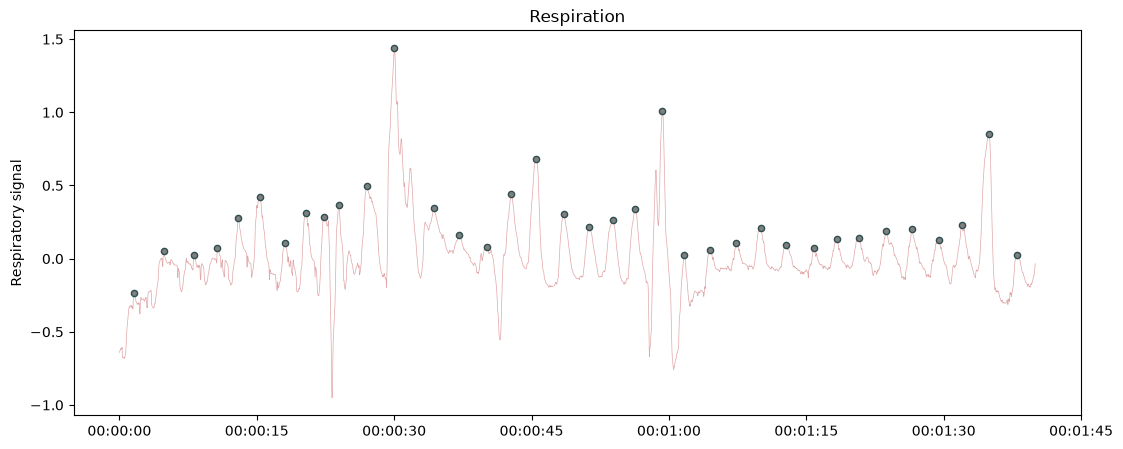
<Axes: title={'center': 'Respiration'}, ylabel='Respiratory signal'>
Plot raw respiratory signal#
Using Bokeh as plotting backend#
output_notebook()

show(
    plot_raw(ppg, backend="bokeh", show_heart_rate=True, show_artefacts=True)
 )